
Understanding space can be challenging without appropriate visual tools, which is why architects have traditionally relied on drawings and models. The introduction of perspective in the 1600s was a significant advancement, allowing for a more accurate representation of three-dimensional space (length, breadth, and height) in drawings. This made architectural design more accessible to individuals without formal training in architecture or construction.
However, this approach introduced the limitation of the “right angle” perspective, meaning that buildings could only be fully appreciated from the favored angle presented. This issue persists today, as even the most detailed renderings show only one potential view of a project, capturing just one element and one experiential situation.
Modern design software, similar to films, incorporates an additional dimension: time. This allows for the creation of walkthroughs that convey the designer’s intentions and emotions more accurately to potential clients. No longer restricted to specific details, designers can now fully express their vision.
Design programs build, interpret, and create geometry through a combination of points, lines, and planes (we covered the theory here). For instance, Rhinoceros, a standard industry program, interprets space by constructing basic solid objects like boxes. These solid constructs allow computers to calculate information that mimics real-world objects but are ultimately just representations. The following explanation as previously stated focuses on the pictorial nature of the representation, which might differ from the mathematical inferences that make up the programs logic.
Rhinoceros can display the vertices, surfaces, and normal directions that form these representations using commands like “dir” (Figure 1 below).

Figure 1: A simple cube created with the “box” command. Notice the different vertices (1) and surfaces (2) that constitute the figure.
By extracting the points that form the box and removing the solid, a series of spatial points emerge. This is the same logic serving as the foundation for more complex technologies like point cloud scans (Figure 2 below).
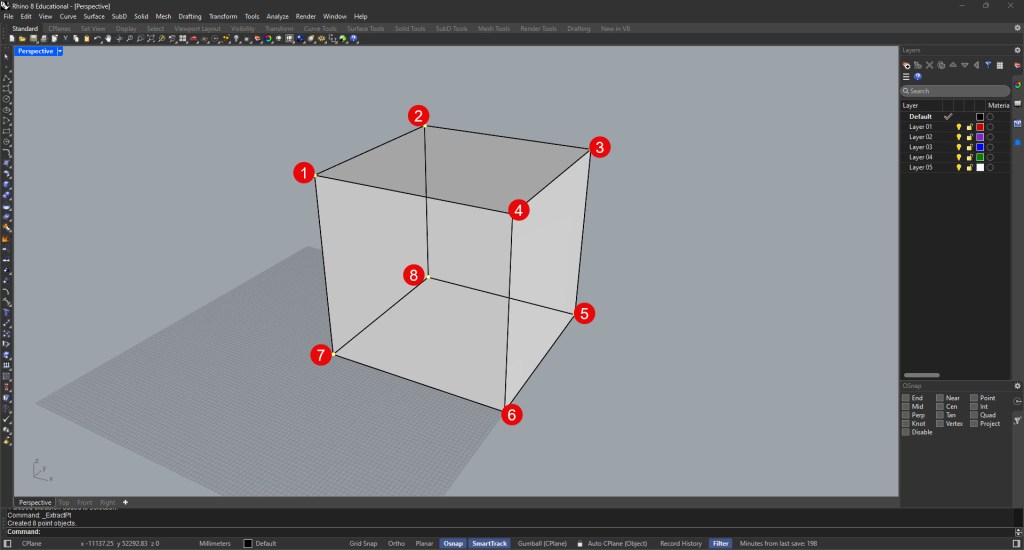
Figure 2: The 8 vertices that make up a cube in 3D space.
These points can be connected by lines to visualize the edges of our constructs (Figure 3 below).
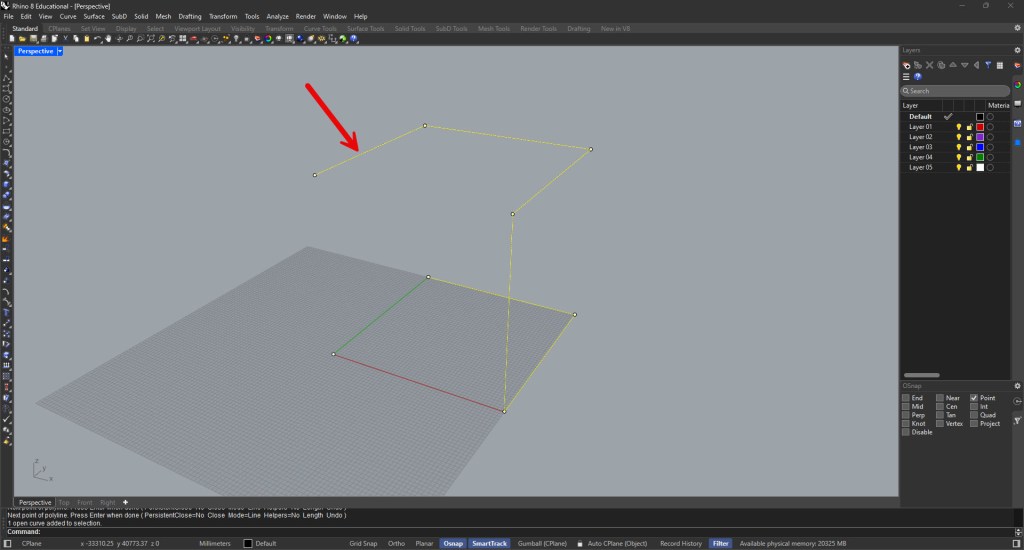
Figure 3: A typical polyline connecting points in space.
Ultimately, these edges can be filled with planes (surfaces) to illustrate space as needed (Figure 4 below).
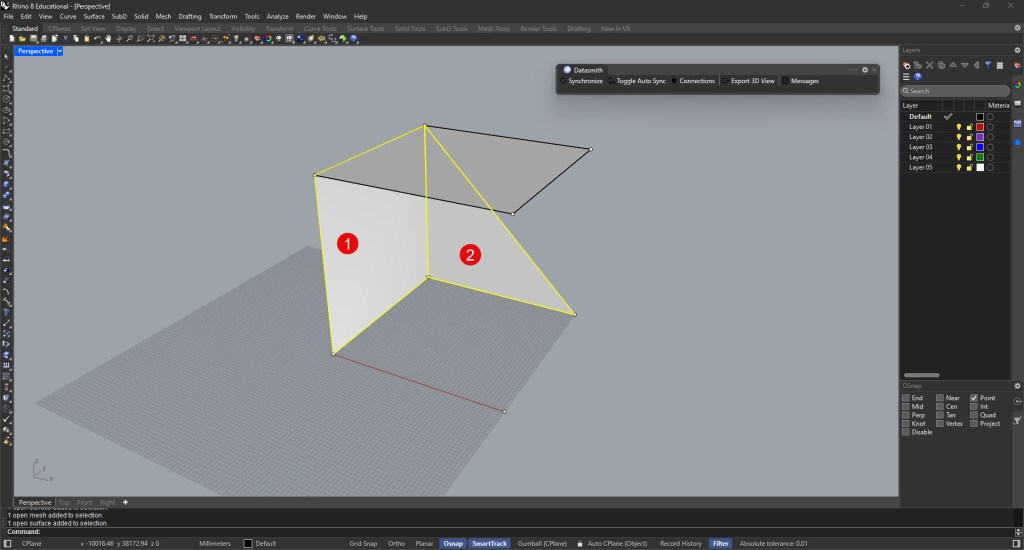
Figure 4: Planes and surfaces between a set of points (1). The same element can be defined using only three points in space (2).
While the true spatial experience can only be fully appreciated in person, abstraction and visualization allow a broader audience to access and understand design intentions.


Share what you think!